

The seatbelt sign is off, the trolley is halfway down the aisle, and the aircraft is cruising through clear sky. There is nothing on the weather radar, because there is nothing for it to see. Then, without warning, the cabin drops. For most passengers, an encounter like this is little more than a jolt and a spilled drink. For a cabin crew member working in the galley, or a passenger standing in the aisle, it can mean a serious injury.
Turbulence is one of aviation’s most familiar hazards, and more serious than its everyday nature suggests. ICAO identified it as the leading cause of aviation accidents in 2023, and EASA has listed severe turbulence, both in cloud and in clear air, among the weather-related hazards that require further investigation. And the atmosphere that aircraft fly through is changing.
In this context, in-flight turbulence has climbed up the European safety agenda. Within ALBATROS, a research project funded by the European Union's Horizon Europe programme, NLR, ALG and the EASA-coordinated Data4Safety (D4S) programme have joined forces to better understand the phenomenon of in-flight turbulence, drawing on operational data of a volume and diversity without known precedent in the study of this hazard.
A familiar hazard in a changing atmosphere
A strong and growing scientific consensus holds that a warming climate is increasing in-flight turbulence, and the evidence is strongest for clear-air turbulence (CAT): precisely the invisible kind described above. CAT is driven by wind shear around the upper-level jet streams, and that shear has already increased since satellite observations began in the 1970s. An increase in severe CAT has been observed over the North Atlantic since 1979, and projections suggest it could become roughly two to three times more frequent over the period 2050–2080. Convective turbulence, the kind associated with thunderstorms, is also expected to intensify as a warmer and moister atmosphere feeds more vigorous convection, although the projections here are considerably more uncertain and vary from region to region.
This raises a very practical question: if encounters with turbulence are likely to become more frequent and more intense, how will we know, and how will we know whether our defenses are keeping pace? Detecting change requires a reference point. Without a robust picture of how often aircraft meet turbulence today, where in the flight it happens, how strong it is and what it leads to, any future trend is hard to see, let alone act on. What European aviation needs is a data-driven baseline of turbulence encounters, built on large-scale operational data rather than on isolated events.
ALBATROS and Data4Safety: joining forces for the first time
That is precisely what the recent study carried out by ALG in collaboration with NLR and the D4S programme set out to build: a data-driven baseline of in-flight turbulence in European operations, characterizing turbulence encounters and the risks and consequences associated with them. More specifically, the project set out to:
- Establish a data-driven baseline of turbulence exposure and its associated safety risks
- Look beyond the encounters themselves to their consequential events and safety implications
- Analyze turbulence at European scale, leveraging the extensive data assets of D4S
- Demonstrate the capabilities of the D4S in support of research-based safety analysis
- Enable future research on turbulence and other emerging aviation safety risks
The scope was deliberately focused. The study covered commercial air transport operations over the period 2015–2025. It examined every airborne phase except take-off and landing (initial climb, climb, cruise, descent, and approach) and concentrated on the two turbulence types most relevant to the potential impact of climate change: clear-air turbulence (CAT) and convective turbulence.
The study sits within ALBATROS, a consortium of 21 stakeholders led by NLR, the Netherlands Aerospace Center. ALBATROS works to improve aviation's resilience to emerging and future hazards, from extreme weather and climate change to new fuels and new entrants such as drones and urban air mobility (UAM) vehicles. One of the questions it addresses is how climate change may affect in-flight turbulence. To answer it, the consortium turned to the Data4Safety (D4S) programme. Coordinated by EASA, the D4S programme brings together European-scale aviation data, safety expertise and analytical capabilities from across the industry. Its members range from 28 National Aviation Authorities and 14 airlines to ANSPs, airports and manufacturers.
Each partner played to its strengths. NLR provided the research framework, guidance and safety research expertise. EASA’s D4S programme contributed its own safety expertise, its data assets and a European-scale perspective. The analytical capabilities came from ALG as the current platform and analytics provider for the D4S programme alongside Paradigma.
This collaboration is the first time the D4S programme and its assets have been used for a research project led by a stakeholder external to the programme, a milestone that speaks to the maturity of the D4S and its ability to support research across the European aviation landscape.
Two complementary views of the same phenomenon
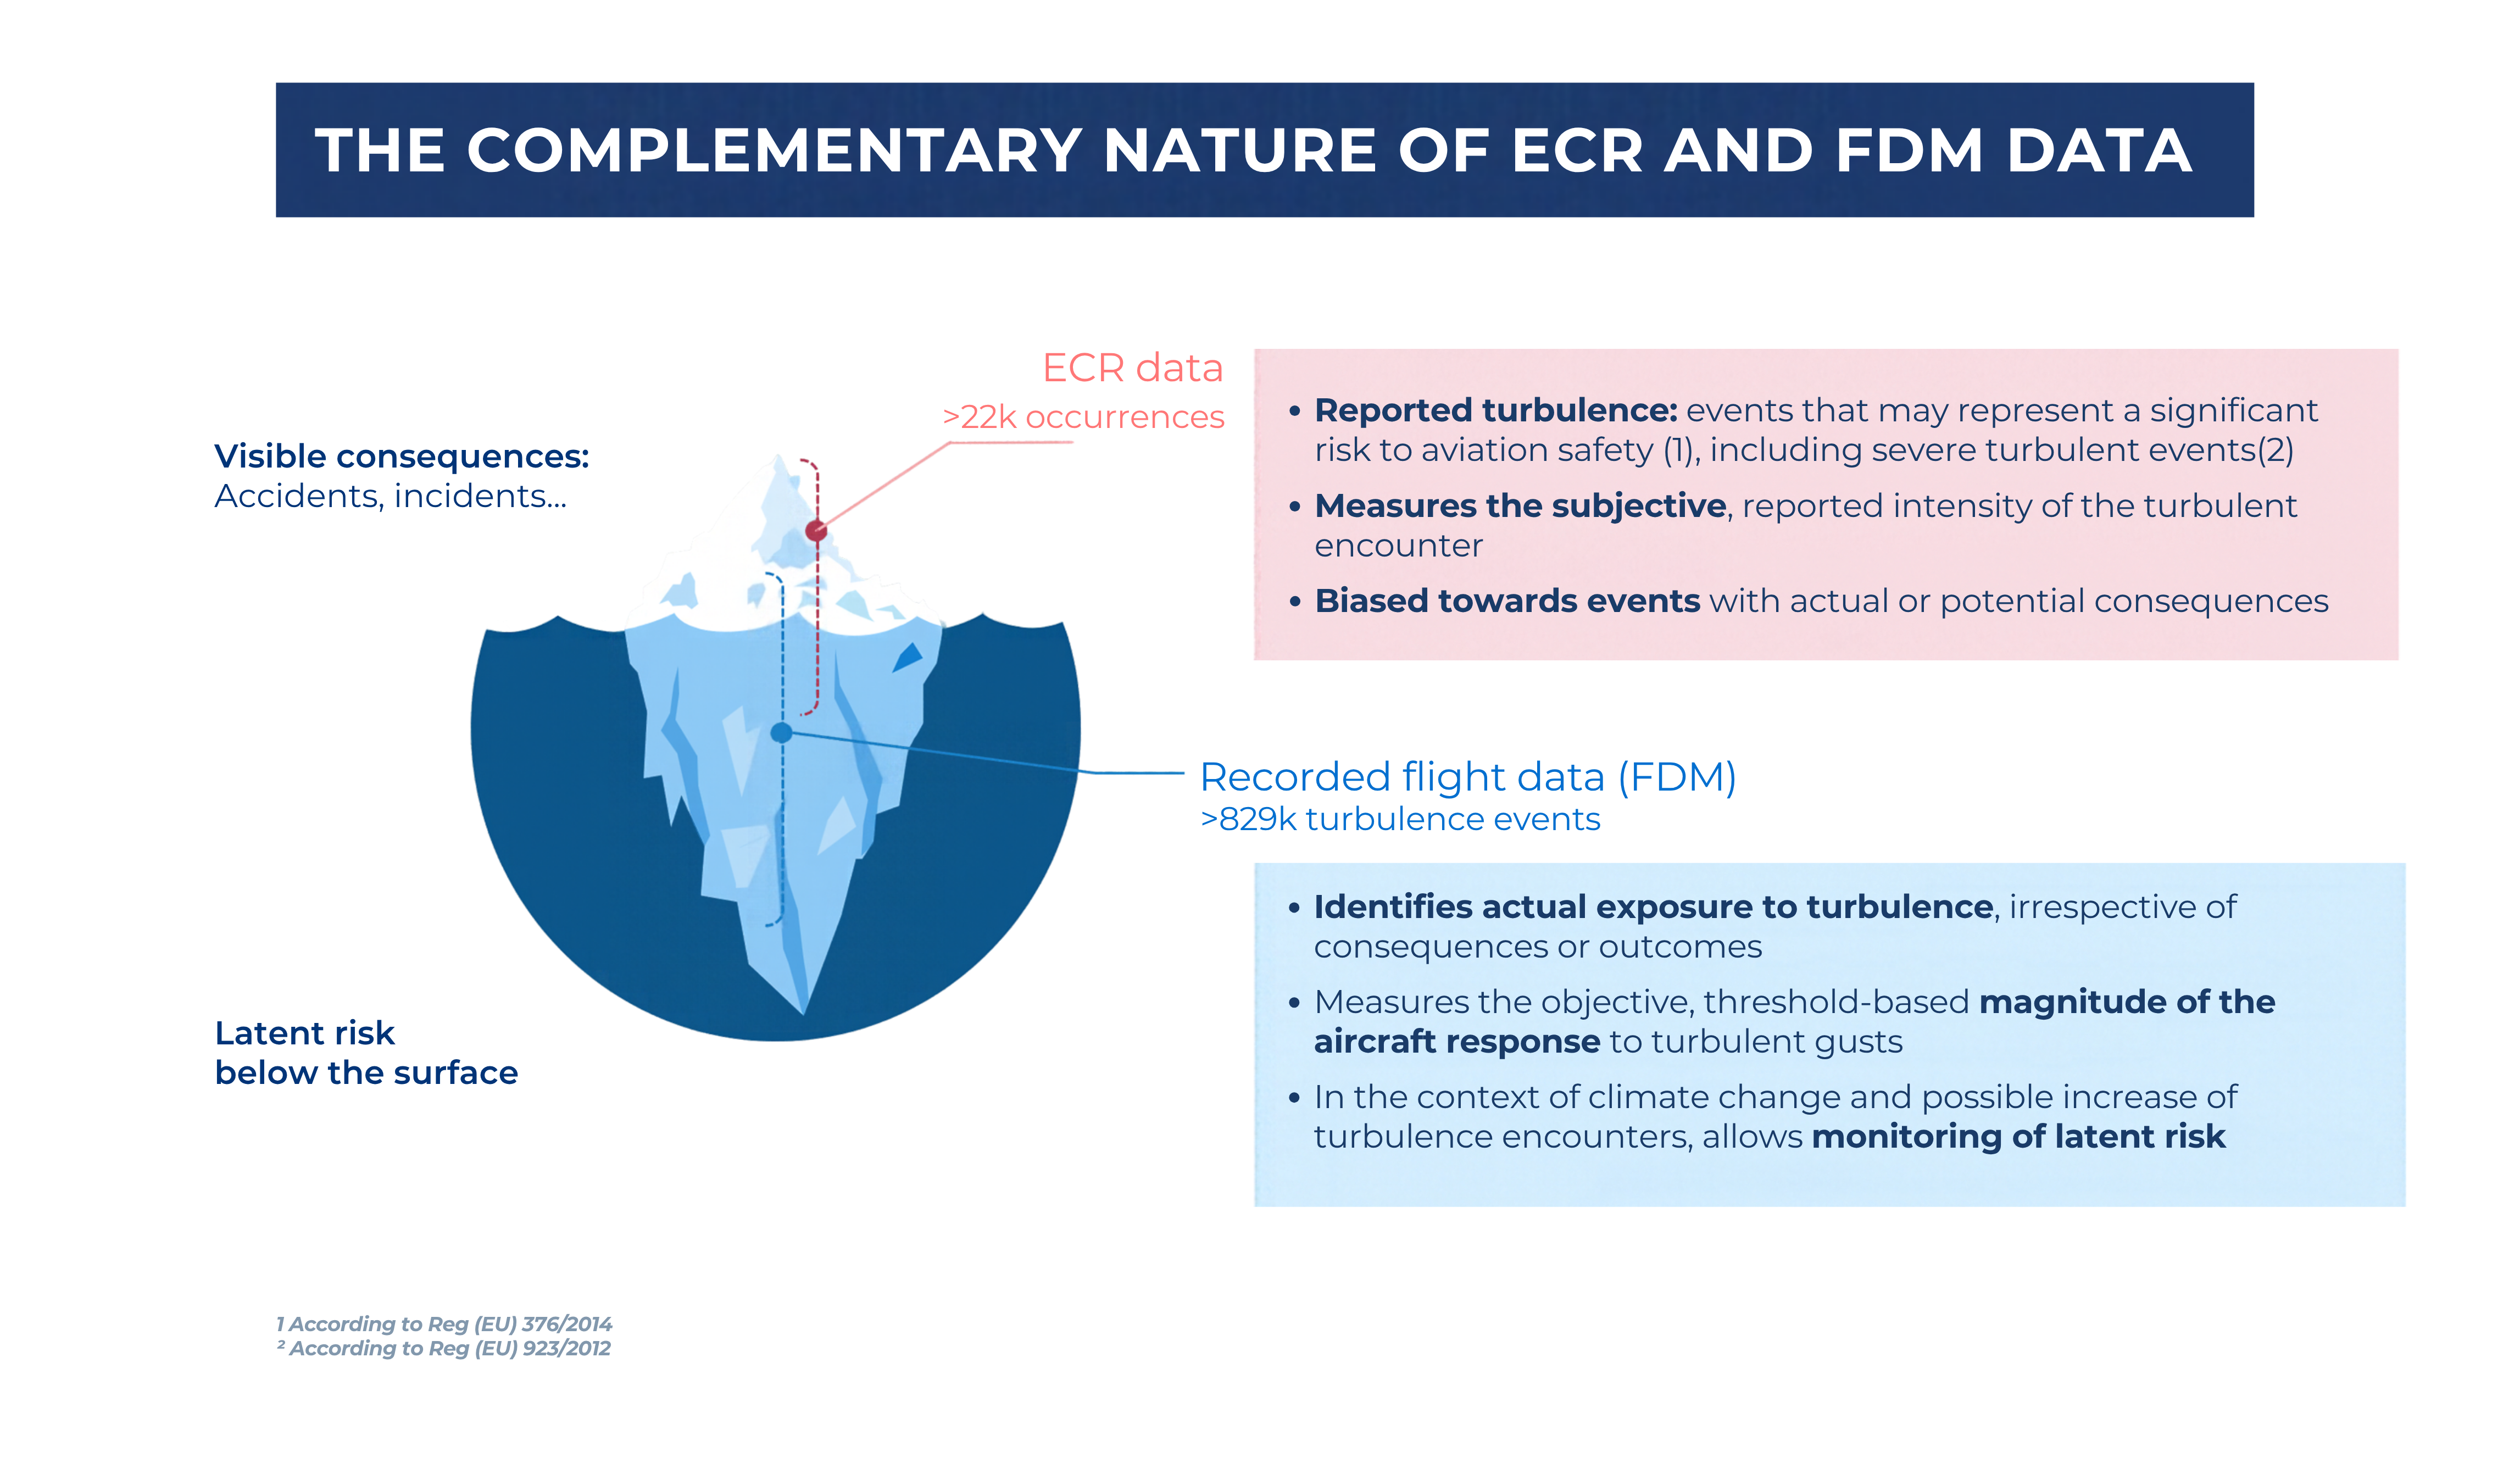
One of the defining features of the study is that it does not rely on a single source of truth. It combines two very different D4S data assets, each of which sees turbulence in its own way.
The first is the European Central Repository (ECR), the central European database of aviation occurrence reports, managed by EASA and fed by the National Aviation Authorities of the 31 EASA Member States. A turbulence encounter becomes reportable when it represents, or could represent, a significant risk to safety, such as a severe encounter or one that injures occupants. The ECR therefore captures reported turbulence: the events that mattered enough to be written up, together with their circumstances and consequences. Intensity in these reports reflects the subjective judgment of the reporter, and the dataset is, by design, biased towards events with actual or potential consequences.
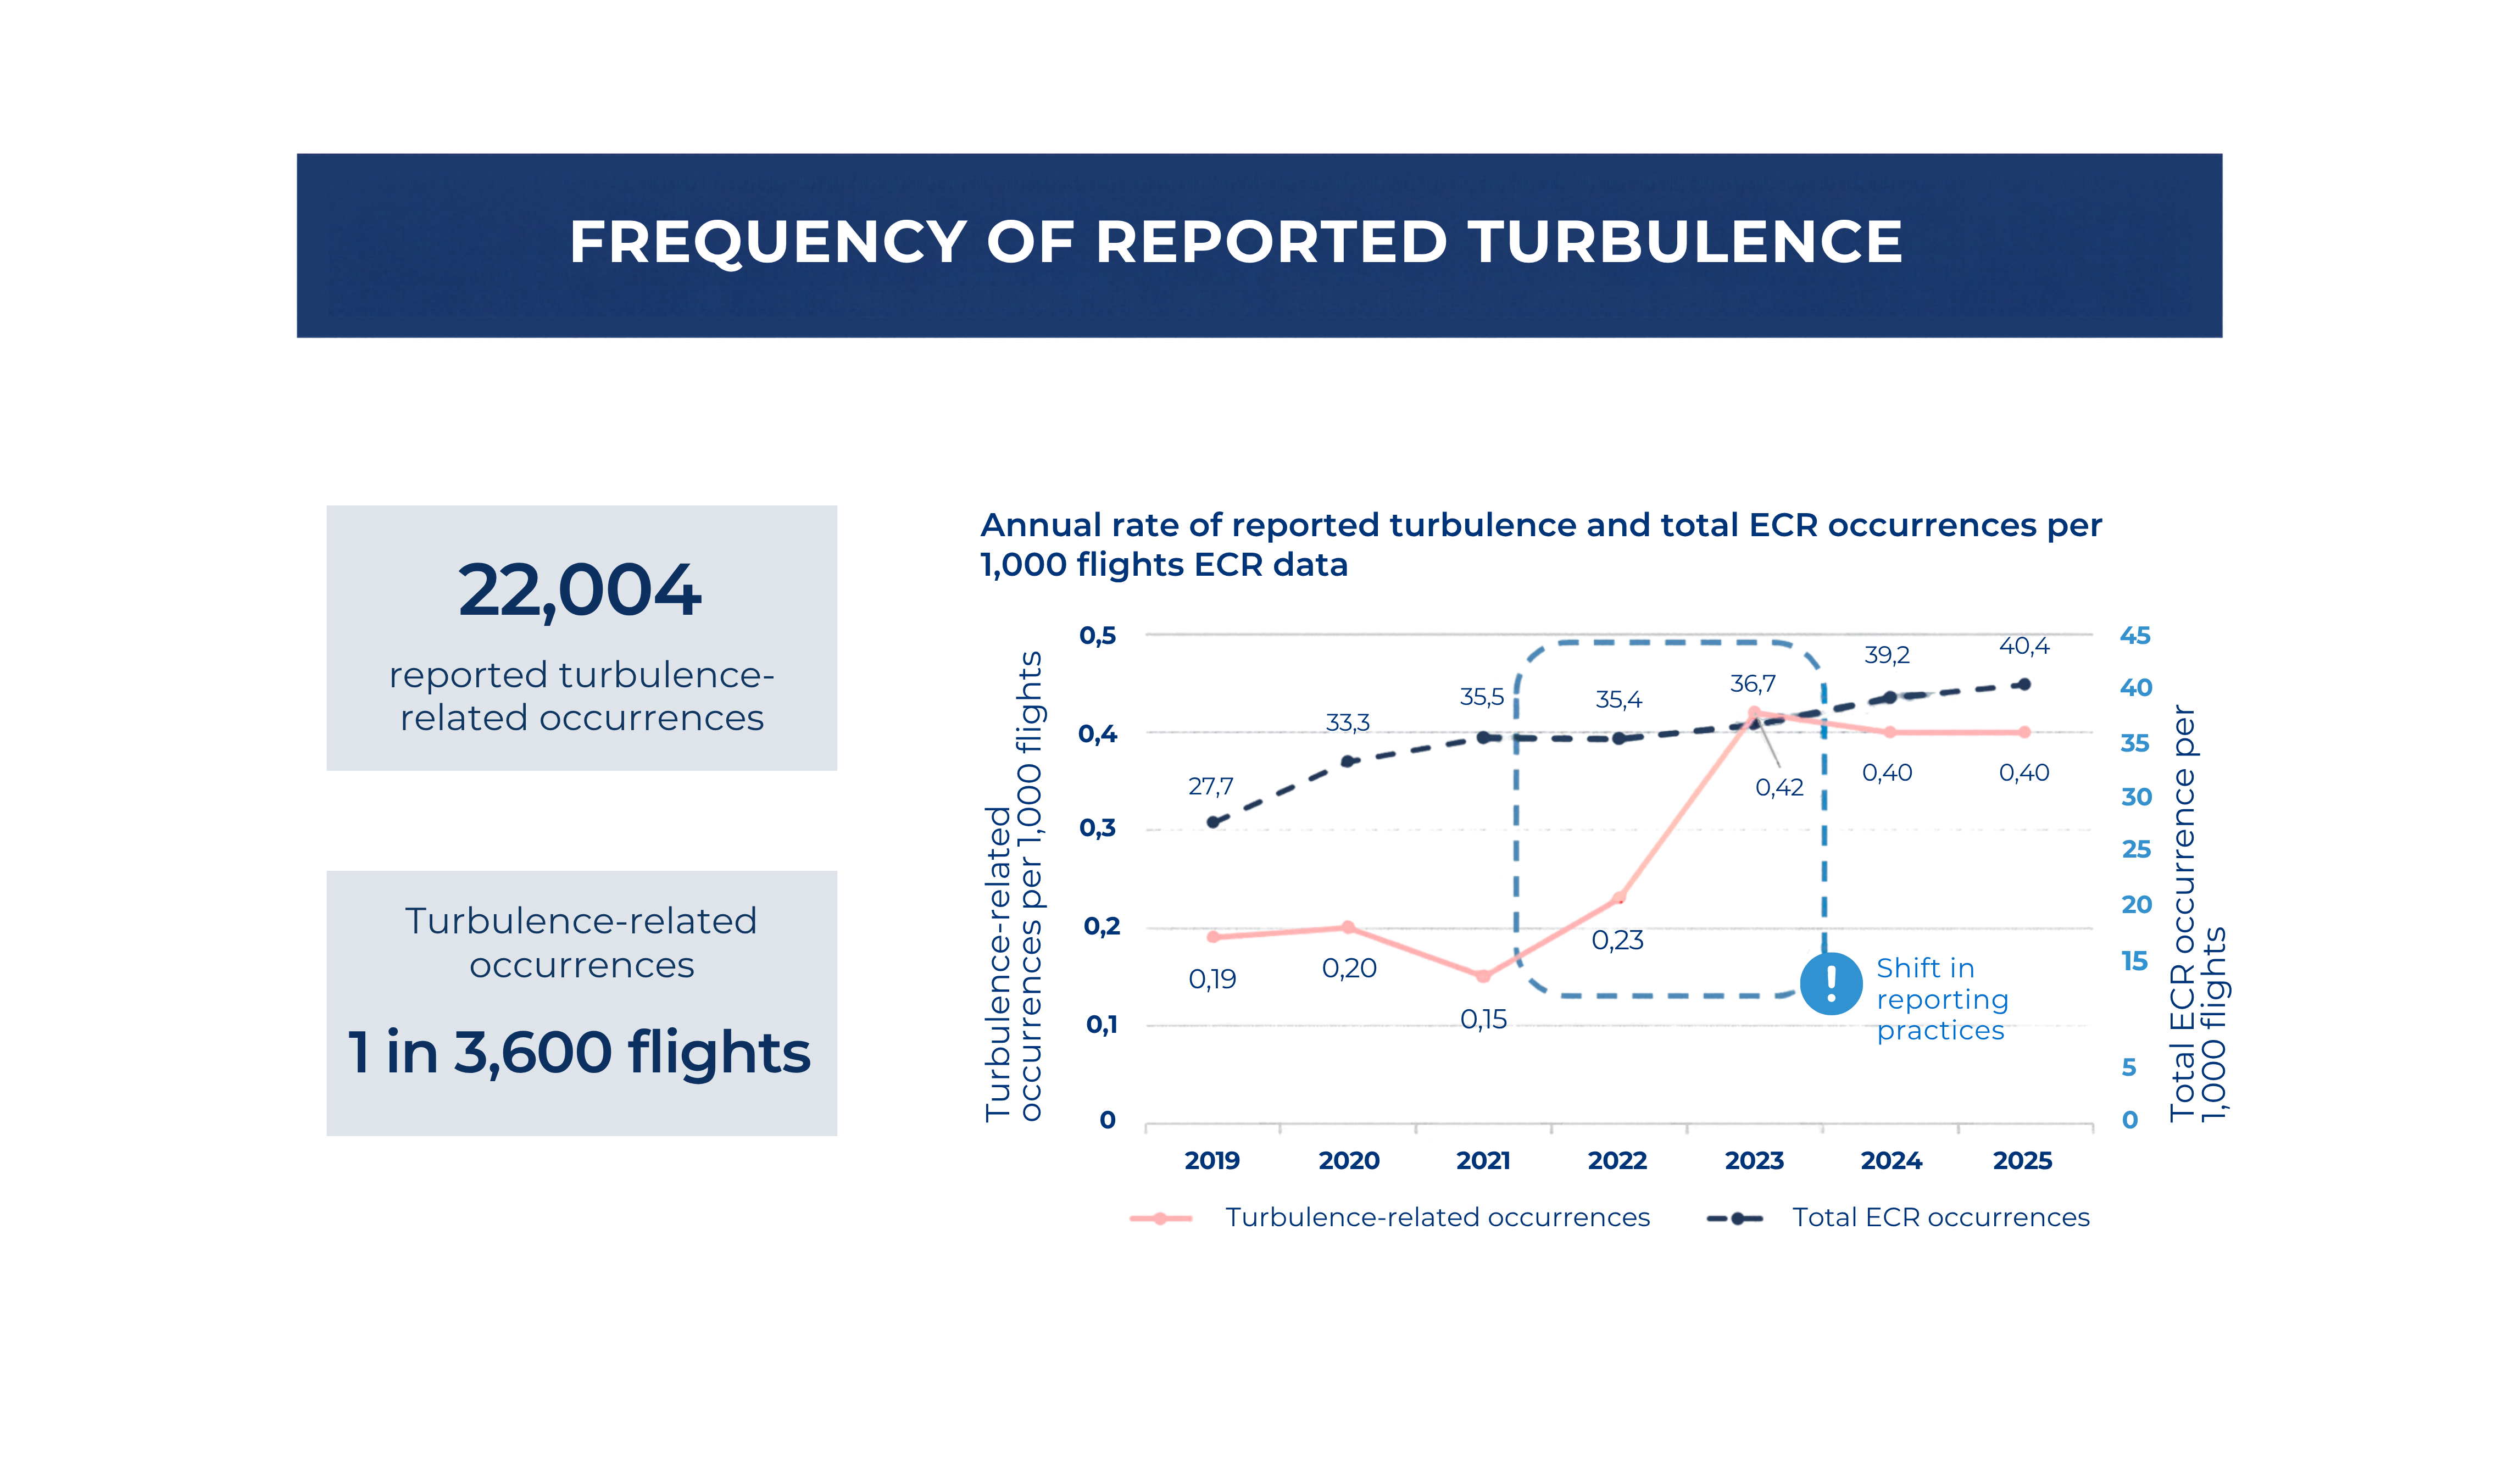
Simply finding the relevant events was a challenge in itself: starting from a sample of over 4 million occurrence records, a pipeline combining structured queries, keyword searches of free-text narratives and large language models (LLMs) produced a final dataset of 22,004 validated turbulence occurrences, with the LLMs also extracting information that is otherwise absent from the structured fields.
The second data source is recorded flight data: the parameters captured onboard by flight data and quick access recorders (generally known as FDM data), shared by six European airlines and processed through dedicated FDM data pipelines developed and maintained as part of the D4S programme. Covering around 4.4 million flights between 2023 and 2025, this dataset identifies actual exposure to turbulence, regardless of whether anything happened as a result. Here, intensity is objective: a threshold-based measure of how strongly the aircraft responded to turbulent gusts, derived from its vertical acceleration and filtered to separate turbulence from deliberate maneuvers.
In a context where turbulence encounters may become more frequent, this is what makes it possible to monitor latent risk, including the encounters that never make it into a report.
Neither view is complete on its own. The ECR explains what happened before, during and after the encounters that mattered; the flight data show how often aircraft actually meet turbulence and how they respond to it. Together, they provide a far more comprehensive understanding of in-flight turbulence and its risks than either could alone, provided they are read with care: the two notions of intensity are related but not equivalent, and cannot be matched event by event.
What the data reveal: a first look at the results
The study covers a wide range of results including the characterization of turbulence encounters using both ECR and FDM data, an analysis of the consequential events that occur as a result of turbulence (such as injuries and aircraft damage) and the performance of the relevant safety barriers, and detailed analyses of in-flight turbulence encounters by altitude, turbulence type, route type, geography, and seasonality, among others.
Interested readers are encouraged to download the full technical report [PG1.1]and to explore the materials from the recent public webinar on the study, including a video recording of the event. Here we offer a sneak peek at three of the most telling themes.
Frequent, but mostly light
The first is that turbulence is common, but mostly benign. In the recorded flight dataset, roughly one in five flights (about 18%) experiences at least one turbulence episode, and an affected flight rarely encounters more than one. A typical episode lasts about a minute. More than 97% of episodes are of light intensity, moderate turbulence accounts for around 2%, and severe turbulence for only about 0.1%, or roughly one episode in every thousand. For the individual flight, turbulence is an infrequent and predominantly benign experience.
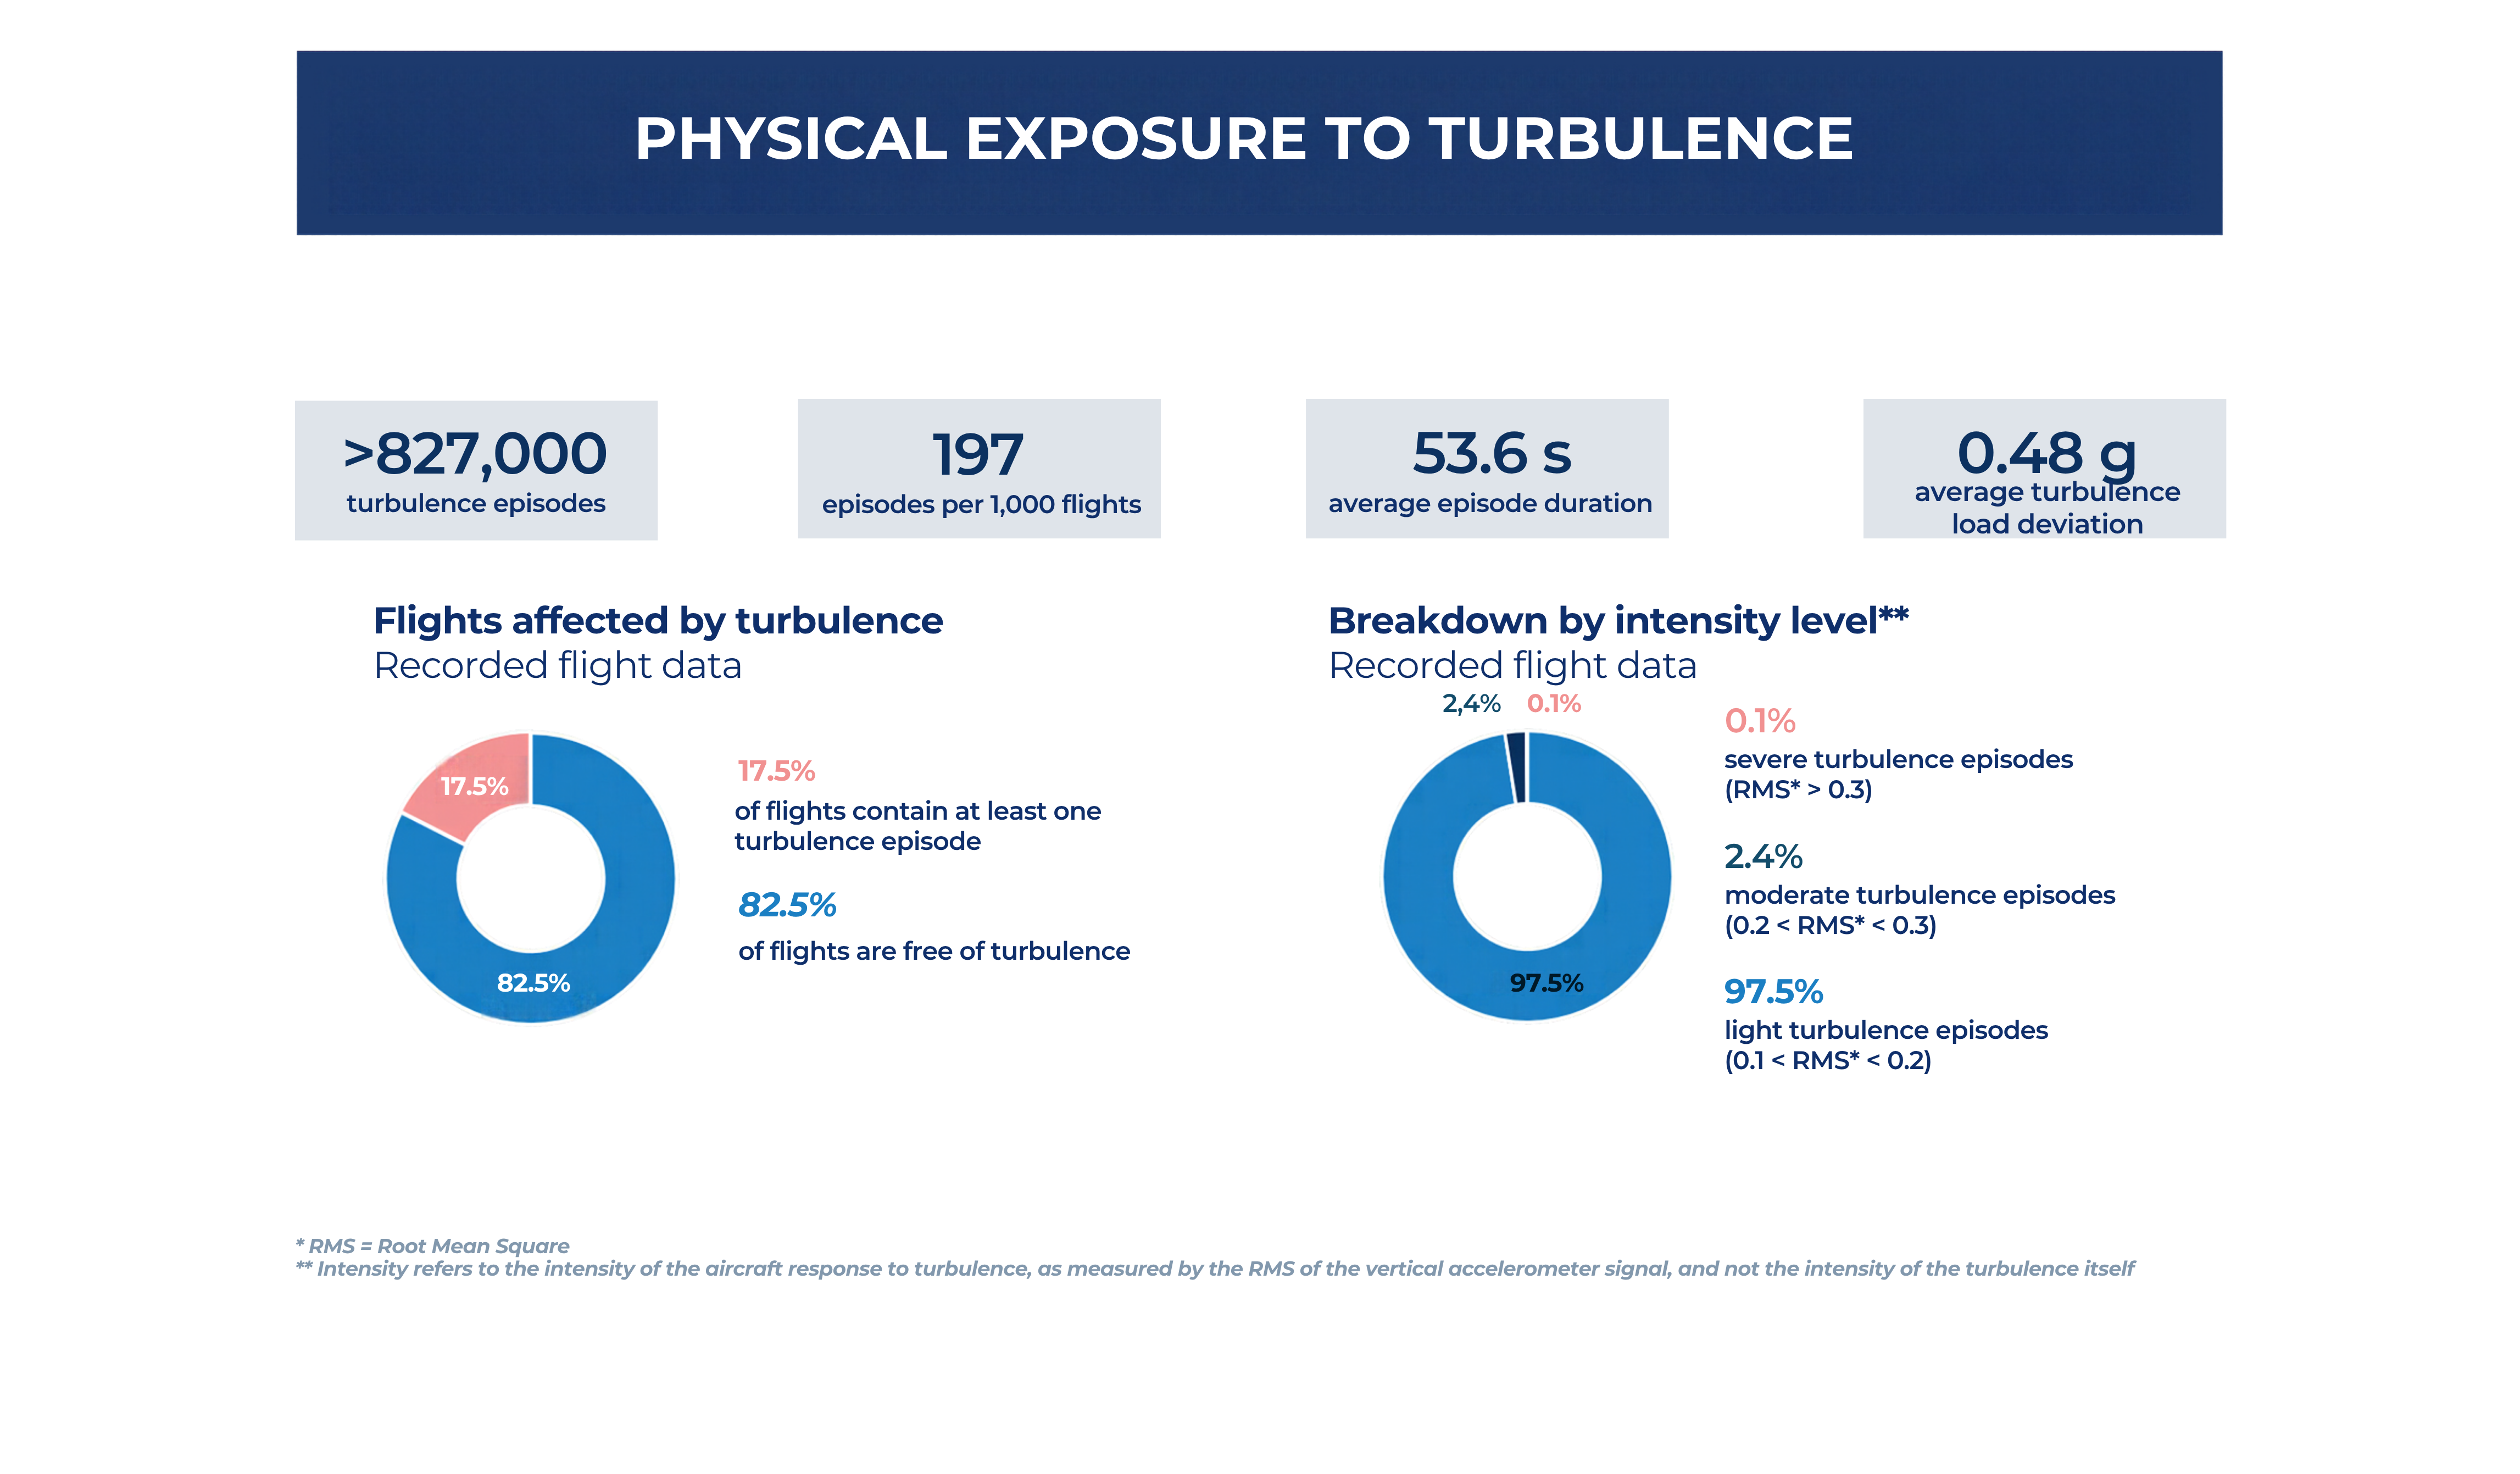
The ECR paints a very different picture, with roughly half of its turbulence-related occurrences reported as moderate or severe. This is not a contradiction but the reporting bias at work, and it leads to one of the more interesting observations of the study. At light intensity, the per-flight rates of the two datasets differ by around four orders of magnitude; at severe intensity they converge to within roughly one (0.24 severe episodes per 1,000 flights in the flight data, against 0.05 to 0.09 reported severe occurrences per 1,000 flights in the ECR). This does not make the two intensity scales equivalent, nor does it amount to a reporting rate. It is, however, consistent with the consequence-driven nature of reporting: the stronger the turbulence, the more likely it is to cause consequences worth reporting, and the more closely the reported picture follows physical reality.
Where turbulence happens is not where it hurts
Adjusting for the time aircraft spend in each flight phase shows where turbulence is encountered the most. The flight data shows turbulence concentrated at lower altitudes and towards the end of the flight: approach sees around 28.5 turbulence episodes per 1,000 minutes of flight and initial climb around 13.9, against just 0.3 in cruise. Climb (1.8) and descent (3.6) fall in between. Although cruise is by far the longest phase of flight, the rate of turbulence per minute flown on approach is nearly a hundred times higher. The report links this concentration at low altitudes and towards the end of the flight to three factors: turbulence-generating mechanisms close to the ground (terrain, surface heating and low-level wind shear), aircraft responding more strongly to gusts in denser air and at lower weights late in the flight, and the greater freedom crews have to steer around turbulence in cruise.
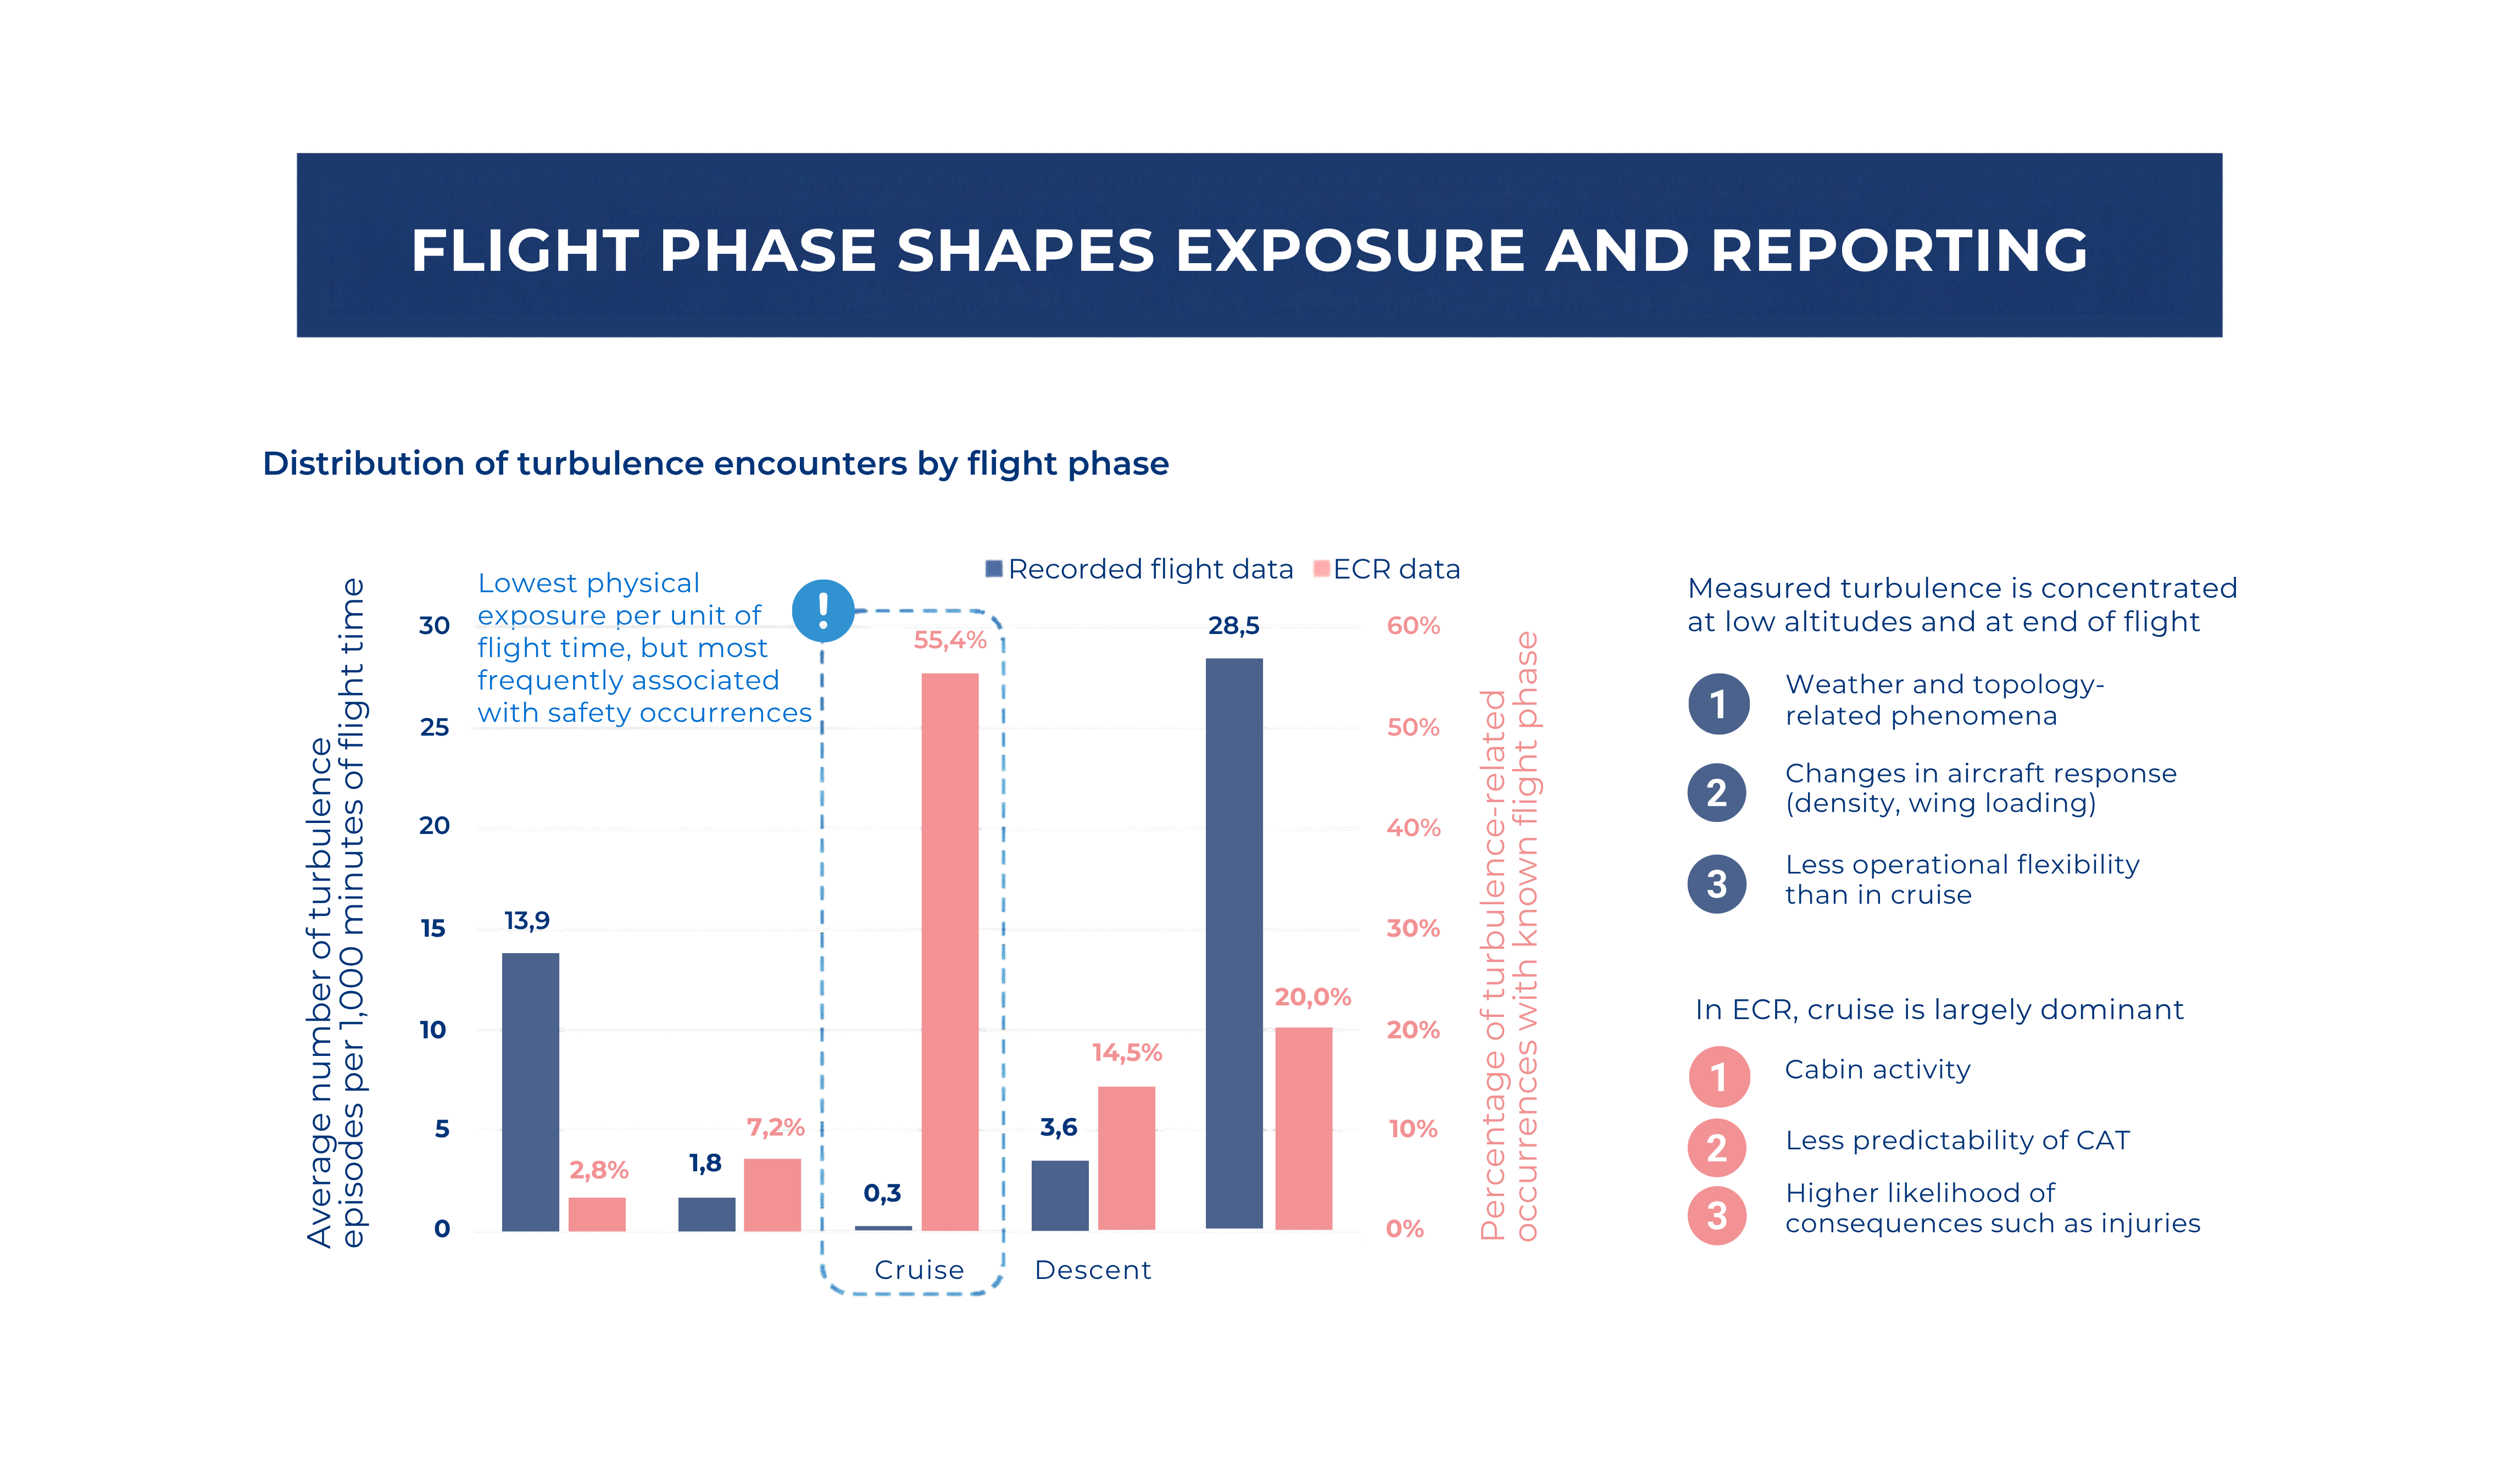
The ECR turns this picture on its head: more than half of reported turbulence occurrences with a reported flight phase take place in cruise. The reasons are revealing. Clear-air turbulence occurs mainly at cruise altitudes and cannot be detected by conventional weather radar, so it often arrives unannounced. Cruise is also when the cabin is busiest, with service under way and passengers walking, standing or seated without their seatbelts fastened. Add the larger share of long-haul flights in the ECR, with their longer cruise phases, and the phase with the least turbulence ends up producing the most reports. Tellingly, about 20% of CAT occurrences involve an injury, compared with under 10% for convective turbulence: not because CAT is more intense, but because of when and how it is encountered. Cabin crew account for the majority of injuries, and passengers seated without a fastened seatbelt are at least three times more likely to be injured than those wearing one.
A further pattern stands out: a distinct cluster of turbulence episodes towards the end of cruise, near the top of descent, appears in older-generation aircraft but not in newer ones. Aircraft generation is only a proxy, so this remains a hypothesis to be confirmed, but it points to weather radar capability as a plausible contributor and highlights the transition from cruise to descent as a moment when timely turbulence information and cabin preparation are particularly important.
From encounter to consequence
The third theme relates to the consequences that in-fight turbulence encounters lead to and the performance of the safety barriers in charge of protecting against and mitigating such encounters.
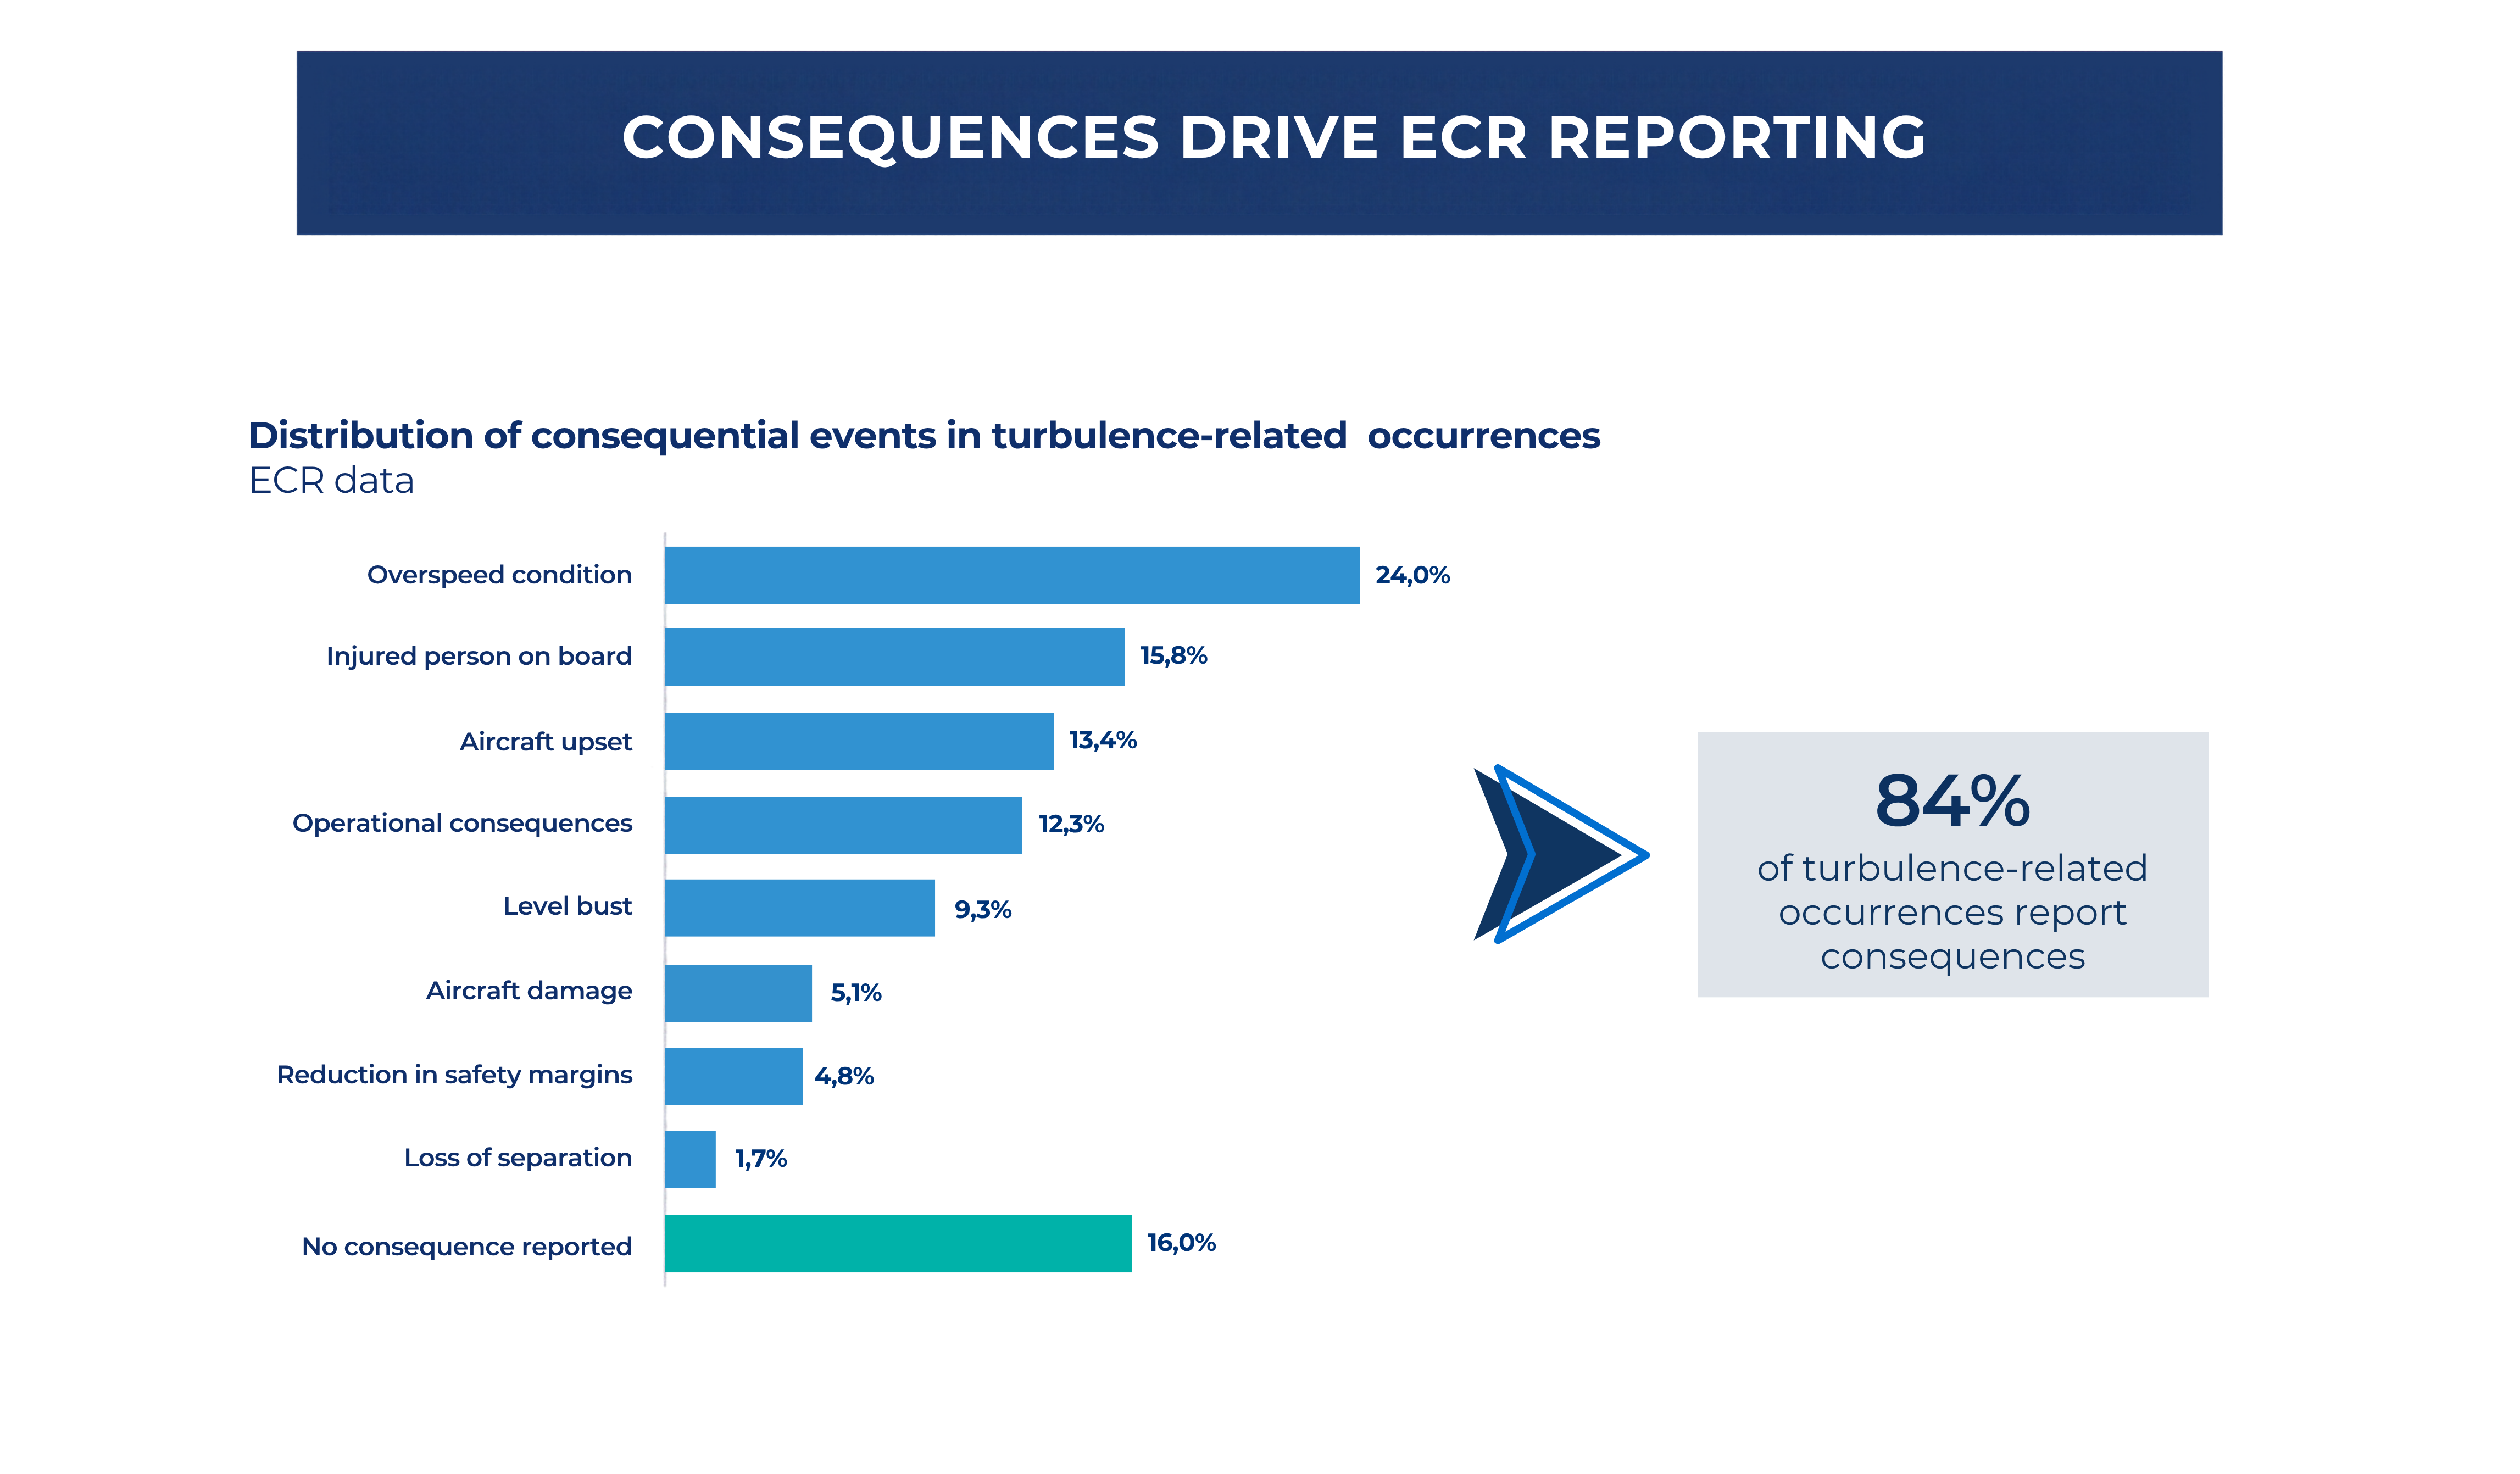
The key question is: what does turbulence actually lead to? In the ECR dataset, 84% of turbulence-related occurrences record at least one consequence. That is unsurprising, since consequences are what drive reporting. Overspeed is the most common (24%), followed by injuries to people on board (16%), aircraft upset (13%) and operational consequences such as diversions (12%). Injuries are about three times as frequent as aircraft damage (5%), which is mostly minor. These shares describe reported events, not turbulence encounters in general.
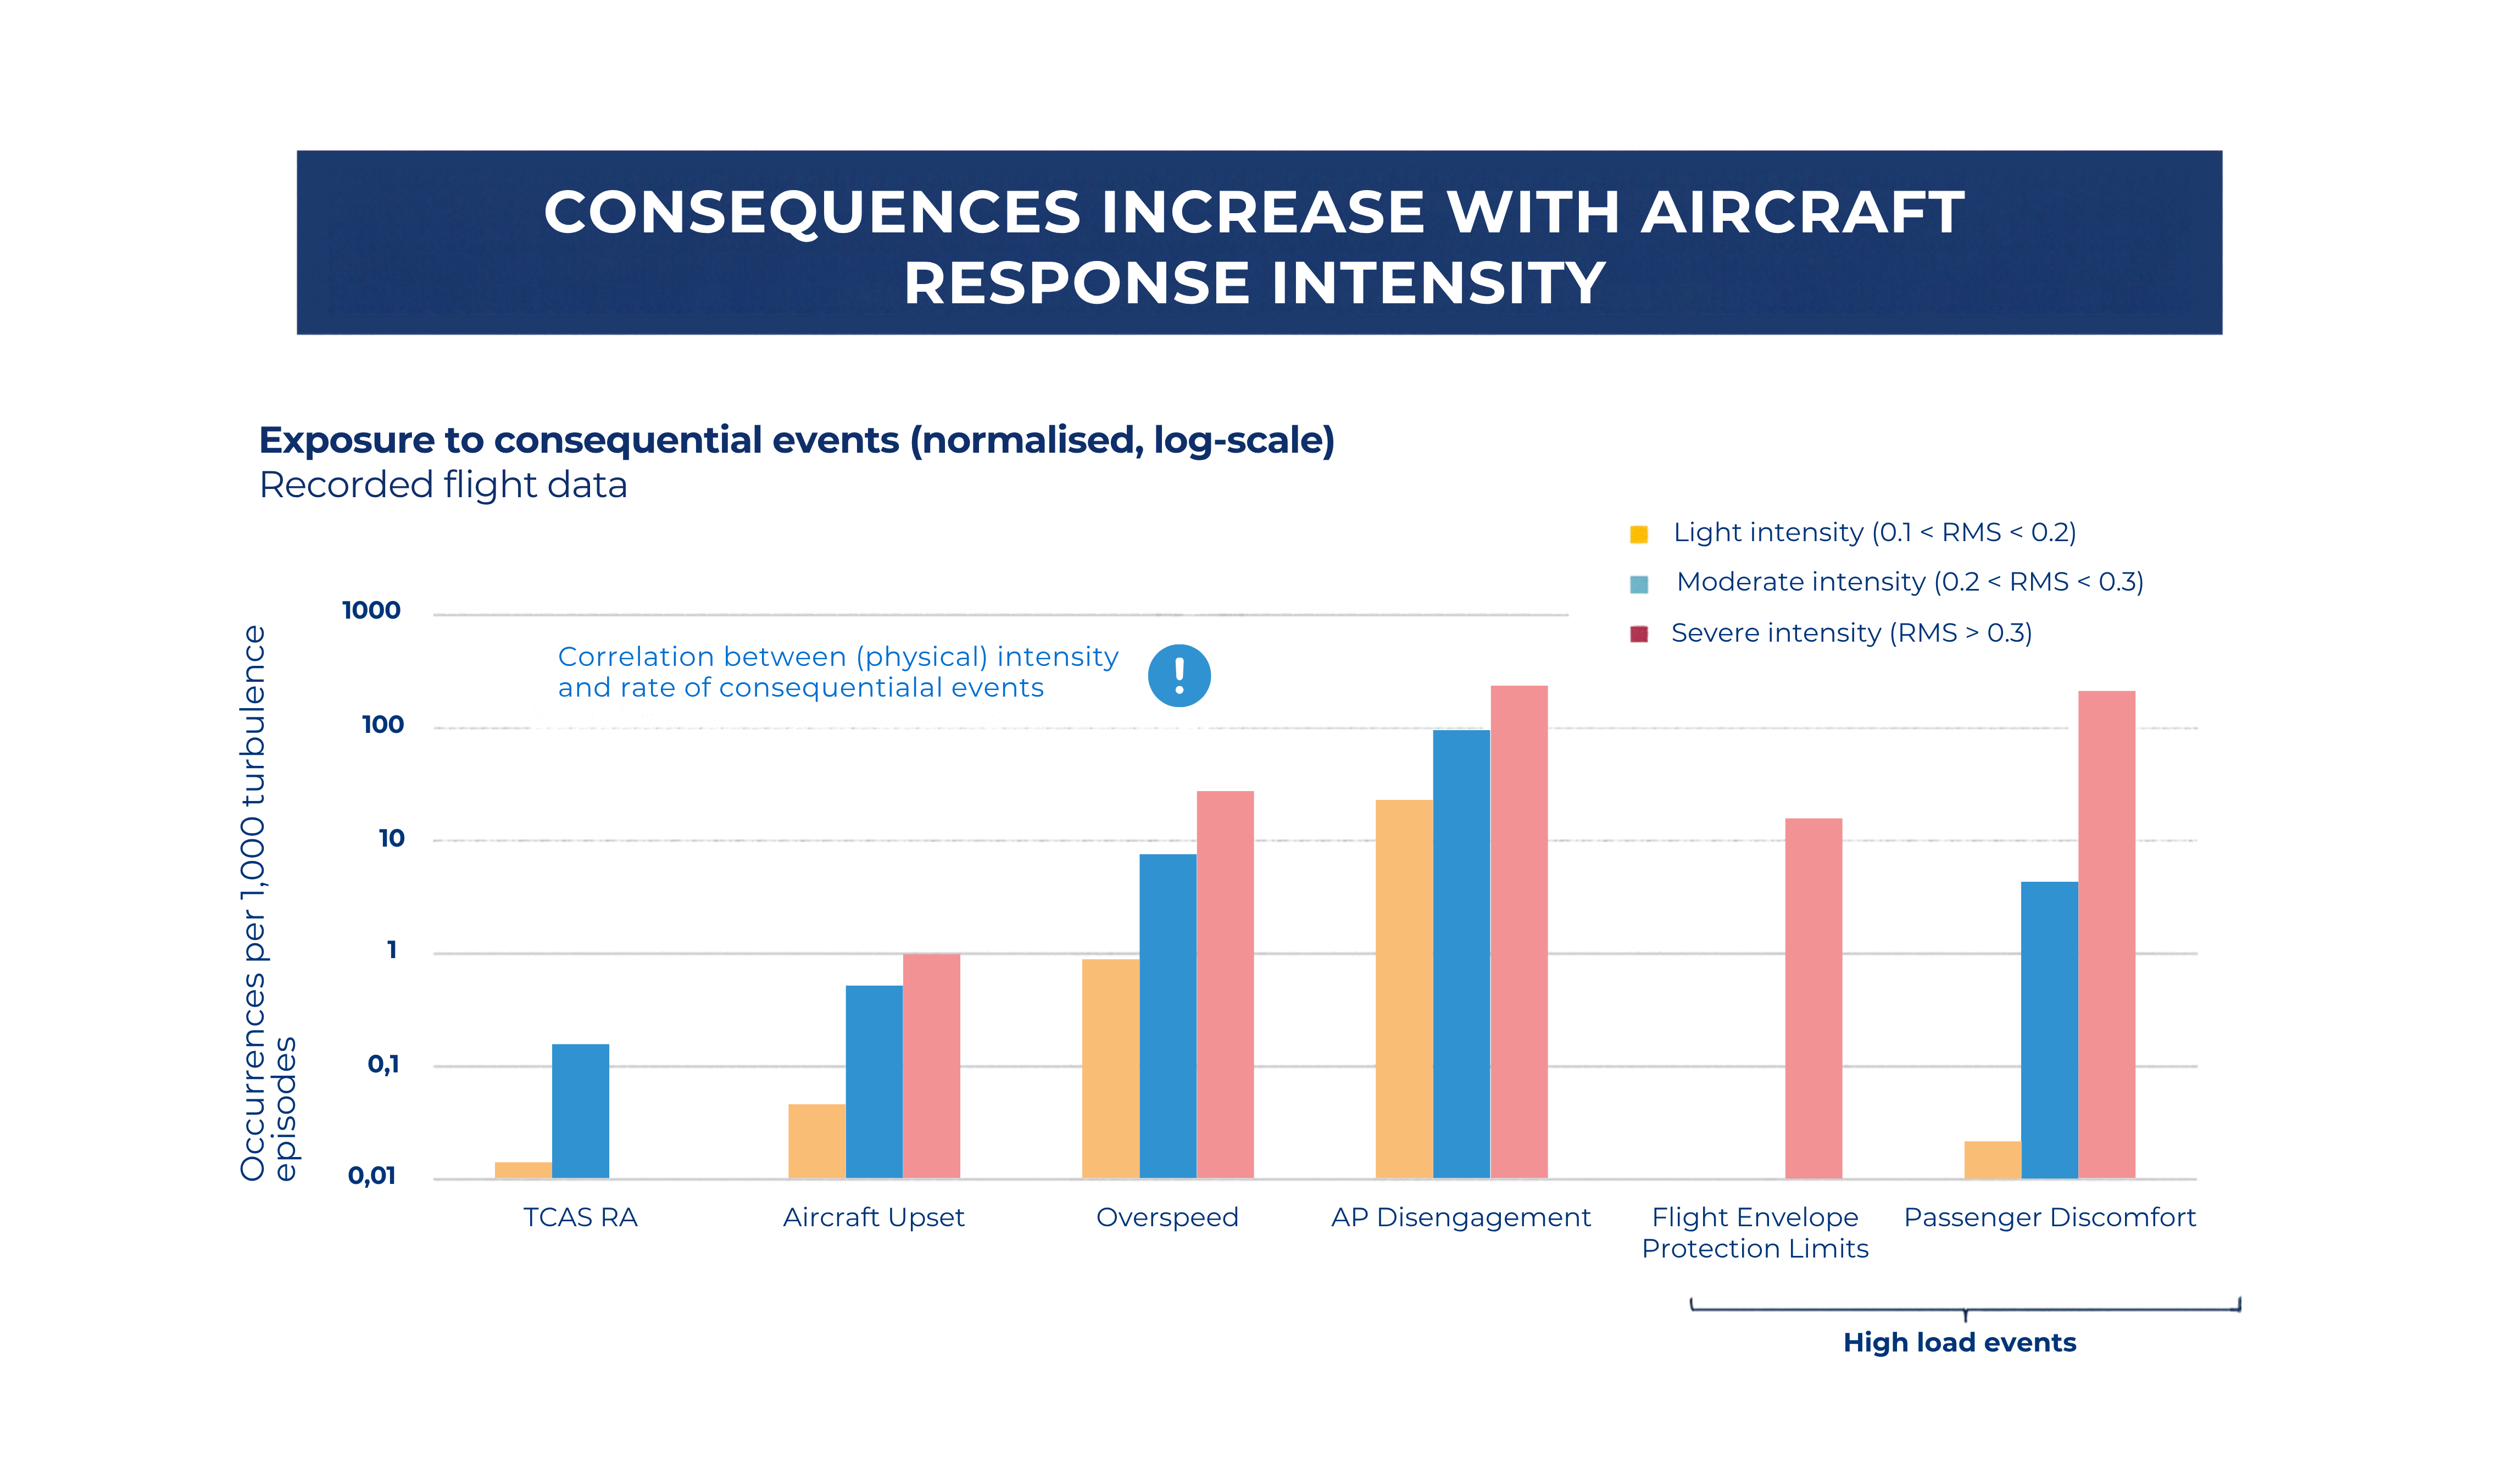
The recorded flight data completes the picture. It show how often turbulence triggers consequences that can be detected from flight parameters, whether or not anyone reported them. The pattern is clear: although severe turbulence encounters accounts for only 0.1% of episodes, consequential events become one to two orders of magnitude more frequent from light to severe intensity. Autopilot disengagements are the most common, and overspeed events rise from about 1 to 27 events per 1,000 episodes. Exceedances of flight envelope protection limits appear only in severe episodes and remain rare.
Reassuringly, most consequences occur in isolation rather than as a cascade. The full report examines each of these events in detail.
As stated above, these are only highlights. For the complete analysis, including the methodology, the figures behind each finding and the limitations that frame them, we encourage readers to download the full report and to explore the materials from the recent public webinar on the study.
From a one-off study to continuous monitoring
Taken together, the findings suggest a shift in perspective. Turbulence is predominantly a low-intensity, low-consequence exposure, but its risk is concentrated in specific circumstances: an encounter that could not be anticipated, a cabin that was not prepared, occupants who were not restrained. That makes turbulence less an uncontrollable atmospheric hazard and more a challenge that can largely be managed through timely information, avoidance and preparation. And because clear-air turbulence, the type most associated with injury in this study, is also the one most consistently linked to climate change, the case for better detection, forecasting and sharing of turbulence information is only getting stronger.
Equally important is what the study represents. It establishes a baseline against which future changes in turbulence can be monitored and tracked over time, and it supports evidence-based safety analysis and decision-making through a comprehensive view of the hazard. It also demonstrates, in practice, how collaboration and data sharing can enable research that no single organization could carry out alone:
- Multi-modal turbulence identification: Combining ECR narratives with recorded flight data captures both reported events and the measured aircraft response, offering a broader view of turbulence than either source could provide alone.
- Unprecedented data volume and diversity: Data from multiple operators made possible a first-of-its-kind, large-scale European study of turbulence.
- From research to monitoring: The analytics developed in the study may be operationalized as safety performance indicators within the D4S platform, paving the way towards a data-driven European framework for monitoring turbulence continuously.
- Interdisciplinary expertise: The study brought together EASA’s safety expertise, NLR’s scientific and operational expertise and ALG’s data analytics and AI capabilities within a European research framework.
The experience also offers lessons for what comes next. Reliable, actionable results depended as much on aviation safety and flight operations expertise as on analytical capability, and the value of D4S will keep growing as subject matter experts gain appropriate access to de-identified data. There is also plenty left to explore, from linking individual occurrence reports to their recorded flight data to adding the meteorological context needed to identify turbulence type in the flight data. Airlines, meanwhile, can already use the findings as a starting point for their own turbulence risk reviews and assess the identification methodology within their flight data monitoring programs.
Above all, the study shows that the data assets of D4S have reached a level of maturity at which they can support research of this kind for the benefit of, and in collaboration with, the European aviation industry.
The collaboration between ALBATROS and D4S has unlocked data-driven aviation safety research on in-flight turbulence at a truly European scale. As the atmosphere changes, the real test will be turning this baseline into a living capability: monitored continuously, refined as more data become available, and used to ensure that turbulence remains an uncomfortable experience rather than a dangerous one.
About the authors

Núria Alsina Pujol
Aeronautical engineer with a specialisation in air navigation and systems, certified in project management and scrum methodology. Principal at ALG and head of digitalisation and advanced analytics in the Transportation practice.

Carles Molins
Aeronautical engineer with MScs in Aerospace Dynamics and Control, complemented by extensive training in data analytics, machine learning, and software development. Team Leader at ALG, specialising in advanced analytics, solutions development, and strategic projects for airport operations, regulatory frameworks, and aviation safety data processing.

Pablo González
Aerospace Engineer with a BSc and an MSc in Aerospace Engineering, specialized in ML/AI techniques for aerospace applications. Consultant in the AI & Digital Transformation team at ALG, with experience developing data-driven solutions for the aviation sector, strategic AI/ML deployment, and airport operations.

